An End of Day Template to Level Up Your Trading
What Would You Do? Let's see...
If you aren’t familiar with Mike Webster, I highly recommend you spend some time this week familiarizing yourself with his content and educational material. In short, he is an O’Neil Disciple and traded hand in hand with William O’Neil.
Here’s one of my favorite videos of his (along with Joe, Tom, and Irusha!):
Before Mike started trading a private fund and still worked at IBD, he regularly posted a “What Would Webby Do” article, reviewing the action in the general market for the day. He would then take each day and make it into a larger blog post covering the action for the week.
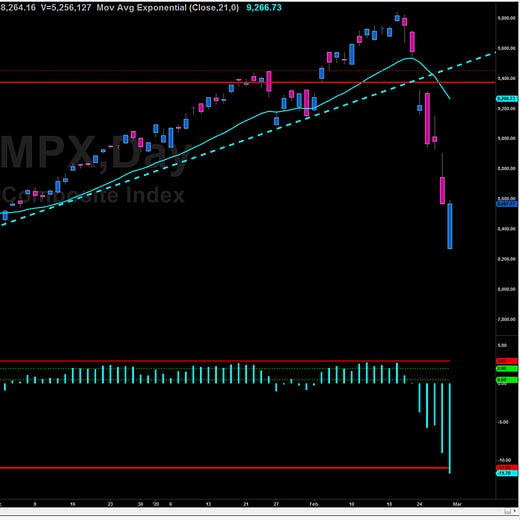
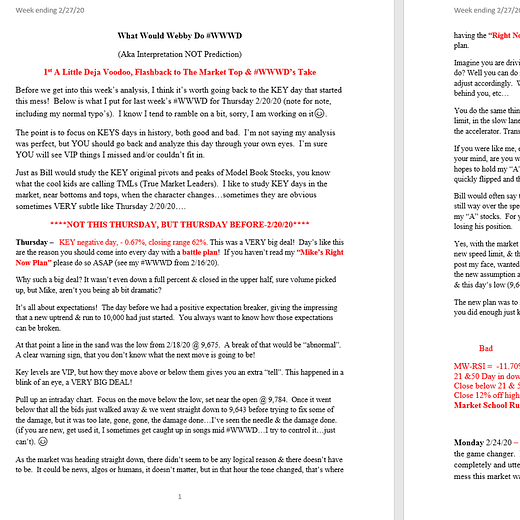
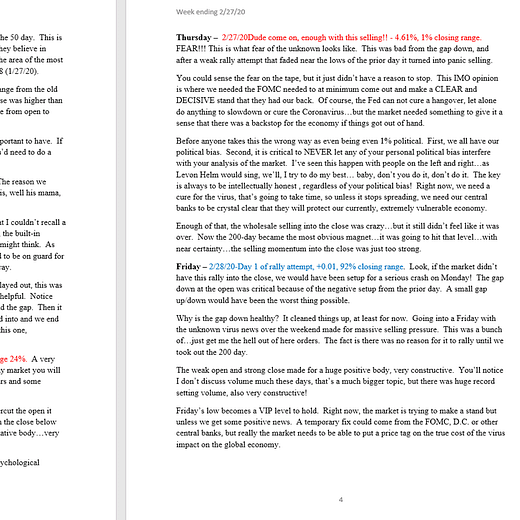
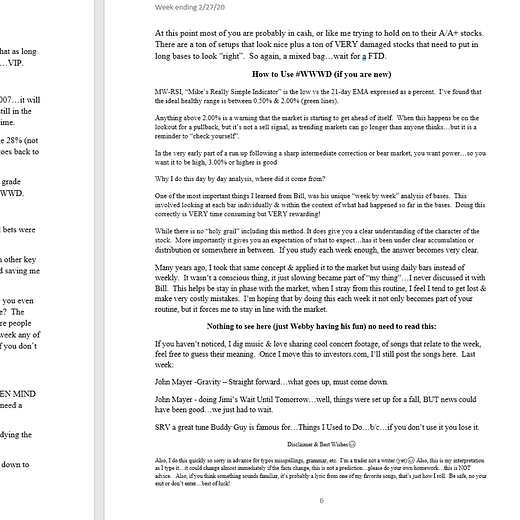
Here’s a tweet he has from 2020 going through this process:
As you can see, it’s pretty in-depth. Having this amount of time to recap the day isn’t practical for every trader out there (and wasn’t for me!) so I decided to take what he did and dumb it down a bit.
Here’s how you can split up the “What Would Webby Do” template into digestible pieces to recap the current day’s action in 15 minutes or less:
1. Day & Date
For example: Monday, 2/13/2023
2. Market Outlook
Here you can recap anything about the market’s action today or the recent environment overall. I like to put down important upcoming events that have the ability to move the market one way or another (CPI tomorrow as an example).
3. Facts
Here we are putting down the absolute facts for today’s session.
Price % Change
Volume (greater/less than previous day)
Daily Closing Range
4. Good/Great
In this section, you want to recap all the positives about today’s action. It could relate to the indexes, individual stocks, certain industry groups, etc.
5. Bad
To get a broad view of the environment, especially when referring to this day at a future date, it is important to include both the positive and negative factors surrounding the current day’s action/environment.
6. Candle
Here you can note anything about the current day’s candle. Was it impressive closing range? What type of actual candle was it? Were buyers in control? Were sellers?
You get the idea.
7. Expectation
This is the most important part of the routine.
Take everything you’ve written above and dumb it down to your gut feeling — are we going higher, lower, or sideways tomorrow?
After each session, you can review your expectations from the prior day and see what actually happened. This will help you build feel and intuition as you gain more market experience.
8. Webby RSI*:
The Webby RSI is not the traditional RSI indicator - it is even more simple. Here all we are doing is checking today’s low vs. the 21 exponential moving average.
Over time you will see a relationship develop between the two - the higher stretched we are from the 21EMA the greater the likelihood of a pullback.
If you want to download this as a Notion template, you can get grab that here for free:
Here’s my What Would Webby Do entry for today to give you an example:
Date: 2/13/2023
Market Outlook: Market resting after the last month’s massive rally. Continue to be patient with new names as we are deep into a cycle. CPI tomorrow which may provide a catalyst one way or another. Overall names holding up where they need to. CRDO standout stock today.
Facts: +1.48%, lower volume, 89% DCR above 10EMA
Good/Great: All massive indexes above their respective 10EMAs, good response from Friday’s close
Bad: Volume could have been higher but overall great action
Candle: 89% DCR, buyers in control on low volume
Expectation: Sideways/Up
WebbyRSI: 1.21%
That’s it!
Hope this helps in some way.
Talk soon,
Greg


This is helpful. Thank you